
Bitcoin Pivots
Bitcoin June 2025 – a Top and a Double Top
23 June 2025
Bitcoin made a lower low yesterday 22 June on a already down trend evidenced on 10 June when Bitcoin made the Lower High. The down trend is intact. Global cycles are bottoming on 25 – 26 June and 30 June and Bitcoin local cycles are topping on 24- 25 June. You know all of that from the previous updates.
However we have some of the most bullish aspects there are on 26 June, 27 June, to confuse everything. So, if we get UP moves from now till end of June and we don’t get a bottom in the last week of June, it will have to be in July.
Gann dates don’t agree that bottom is in either. The first date for a Bottom by Gann is 6 July. Main trend continues to be down regardless of what fakeout moves happen during the week.
20 June 2025
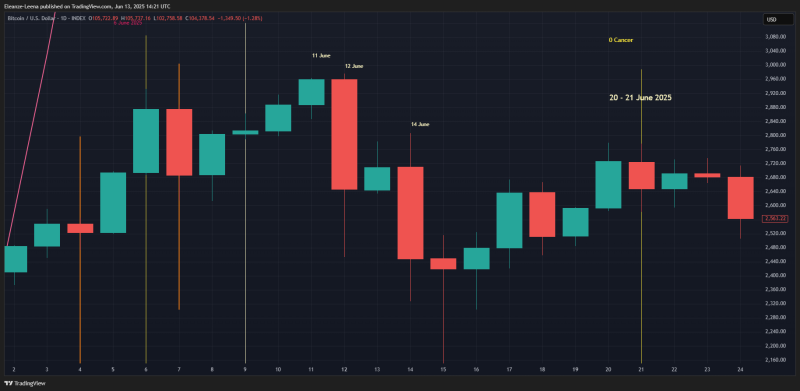
2 examples of what happened on the Bitcoin charts after today’s aspect Mars 150 Saturn. I’m not saying this entire trendline will happen but some of it is expected to happen. This has the potential to invalidate every local top that is forecasted below.
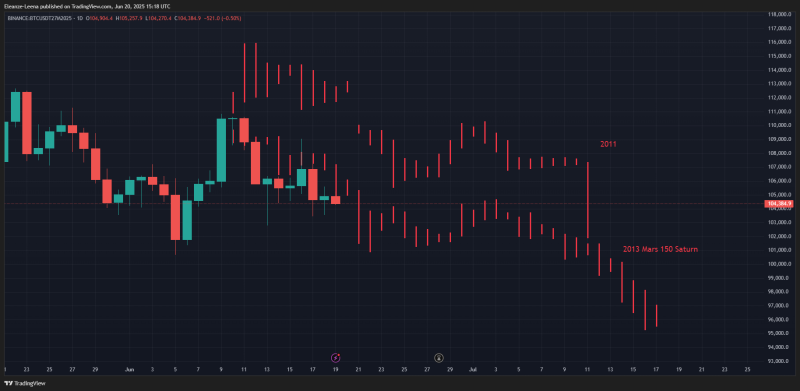
Whatever happens we need to keep in mind that this trend is currently alive and working on the Bitcoin market. It doesn’t work in isolation but it is here with us.
I apologise for not being able to warn you about this aspect in advance. I only completed the back-testing results this morning and I had to delay the Personal Financial forecast for a client because I had to back-test this aspect. So by the time I got organised to find fractals, it dumped. I have tried to hire people to do the back-testing for me and every time they make more than 3 mistakes per aspect and that is unacceptable. I ended up losing money for paying them for 2 weeks and then I had to do that work all over again. I have been back-testing all month and we have been getting important aspects every day in June. Every single day there have been at least one aspect to back-test and often two. The best I can is post the updates as soon as I back-test and that is what I have been doing. Check the most recent back-testing results in the new back-testing blog.
~~~~~~~~~~~~~~~~~~~~~~~~~~~~~~~~~~~~~~~~~~~~~~~~~~~~~~~~~~~~~~~~~~~~~~~~~~~~~~~~~~~~~~~~~~~~~~~~~~~~~~~~~~
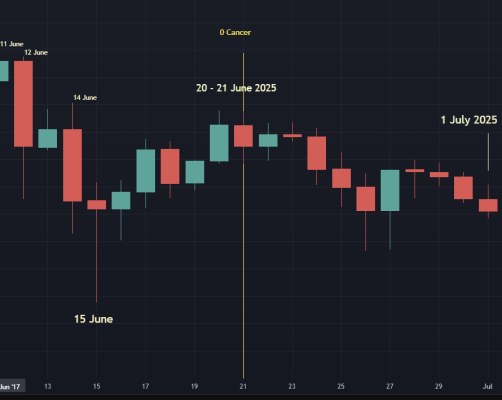
Several confluences are converging on the following scenario for the rest of June:
Pivot High 21 June – 24 June 2025
21 June is better confluenced historically, however we have a BIG GANN DATE for a top on 24 June. Both 21 and 24 are equally confluenced for the June 2025 top.
I haven’t back-tested the Sun Jupiter conjunction on 24 June. I will publish the results here in the next couple of days. That may bring more clarity on which date exactly is the top.
Local bottom on/around 25-26 June 2025. If 24 June is the top, then we expect a) sharp down on 25 – 26 June, b) a bear reversal on 25-26 June or c) and d) discussed below.
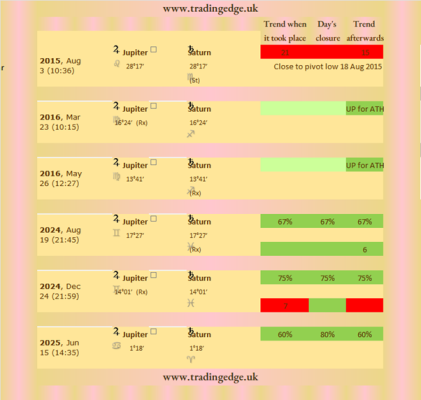
The last 2 Solar Eclipse cycles made their pivot lows on the equivalent of 25 – 26 June 2025. That is not adding up to how 24 June will be the top and 25-26 – the bottom. One way that can happen is c) if we don’t get a top. Heading straight down as a possibility is given to us by the Mars 150 Saturn which took place earlier today on 20 June. It gives us 70% probability of a down trend after the event.
That is quite a high probability. You can see in the previous 3 years, Bitcoin headed straight down after the event.
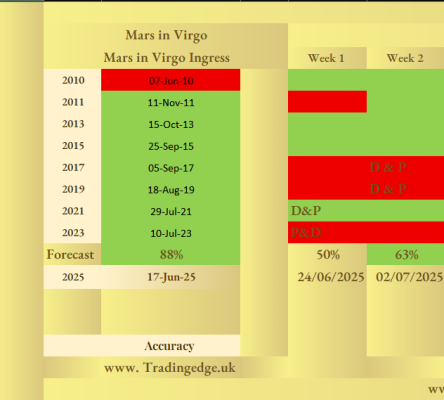
The other way that can happen is d) a 24 June – top and 25-26 June can serve as a bottom, just not a pivot low. A date from which the market goes up. Mars in Virgo gives us 63% probability of 2 July closing higher than 24 June. So it is very possible that 25 – 26 June are both near the top and a bottom for the next Bitcoin moves.
What we are dealing with is two rigid concrete cycles going in opposite directions: the Eclipse cycle heading down giving us the REAL trend, and the season cycle trend going up – giving us the local trend. How they will each find a place on the chart, is more likely with a narrow range of high support and low resistance and playing the range.
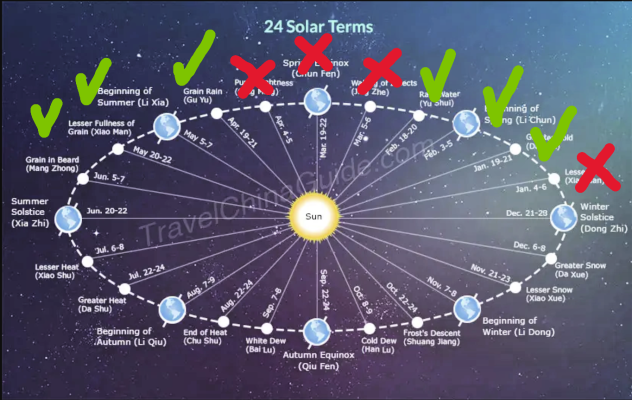
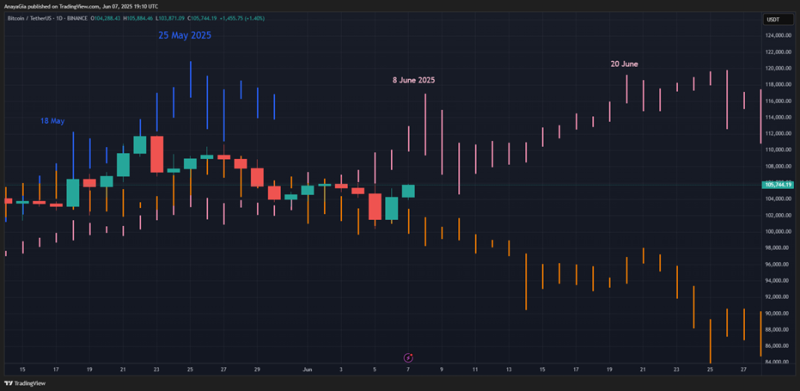
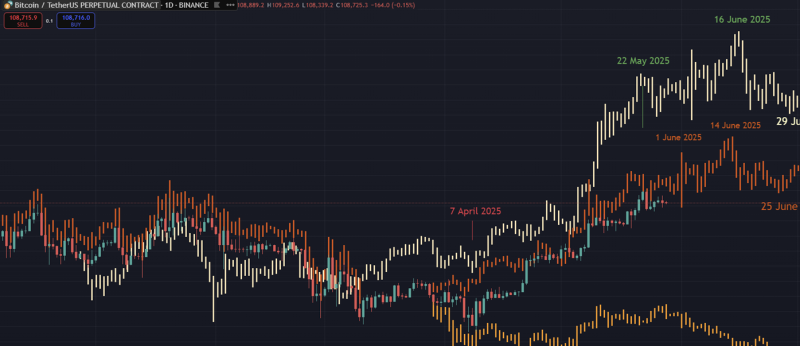
Here is a reminder of the seasonal top which has been running with 60%+ accuracy in 2025. Did Bitcoin make the bottom on 5-7 June? Yes it did. Therefore Bitcoin is expected to make the monthly top on 20 – 22 June with 60% probability.
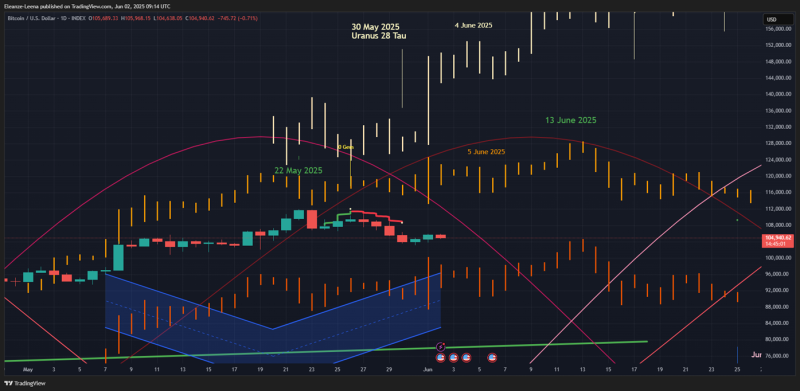
Here the Venus cycle which is currently running, provides an excellent visualisation on how the Eclipse cycle and the Seasonal cycle can play together.
Update 13 June 2025
I missed the Bitcoin top for 1 day, expected it on 11 June, it came on 10 June. In this video I explain the next Bitcoin moves I expect. I may have missed the 13 June bottom, however it is not late to enter a long just not from this current price of $105K. Wait until the MMs come back down to revisit the daily lows and sweep the SL of these keen long positions opened on early 13 June. The bottom I expect is on 14 June or 15 June at the latest where 15 June has a higher probability of closing on GREEN. More info in the video.
Also don’t forget that the Jupiter fractal that I pinned on my profile on X and you can find it further down below, projects a bottom all the way on 18 June. So we may not even get a bottom on 13 – 15 June. It may head straight down. However this is not my favourite projection because I show you in the video the back-testing results of Jupiter Square Saturn on 15 June 2025: 80% historical probability of a GREEN closure.
The scenario that integrates the back-testing results better is:
GREEN closure on 15 June. GREEN closure on 16 June because the back-testing results show 60% probability of the immediate trend after to be UP. And then Bitcoin heading down again on 17 and 18 June to fulfil the Jupiter in Cancer fractal of making a bottom on 18 June.
These are local moves that I am only forecasting to train my forecasting muscles. The main pivot next is the local top on 19 – 21 June. I will try to nail that date nearer the time. I don’t expect that 19 – 21 June price will reach higher price than 22 May because a big bull cycle ended on 12 June. However from a TA perspective, the MMs may pump that high to liquidate all shorts opened on 22 May because you saw the candle on 22 May, it does not look like a TOP candle. It looks like a candle that has unfinished business.
Here is my projection for the next few days showing where I expect the 19 – 21 June top in relation to the previous top. As for the bottom, any time between 13 – 15 June and 15 June closing on a GREEN as per the back-testing results.
You need to do your TA work diligently and open your positions that make sense from TA perspective, not only from Astro.
Update on 9 June 2025
As you saw the Mercury Rahu T square chart that I gave you twice: in May and on 4 June (both charts are below) managed to forecast the bottom on 5 June. Therefore we continue to trust this aspect as a predictor of the coming moves. You can see the back-testing results for the trend after in the table below in the 4 June update. In that table, I have extracted several projections for a coming top: 11 June, 14 June, 19 June. Out of these the most likely is the one that has taken place when Mercury and Rahu were on the most similar degrees, which was in 2016. The projected top from that year is 14 June 2025. However I am attached to my original top dates 11 – 12 June because I have a very important cycle topping then. So we see how it goes in the next few days. Don’t worry about red closing candles before that top. As you can see in 2016 there were 4 red closing daily candles before that top. The top was delivered by some pumps. That is why I coded my public forecast with the words “choppy” to the top. So I expect the top to be fast and furious and then sharp down.
In this 10 min video I give you the back-testing results of 2 x big aspects that took place today: Mercury Saturn Square, in the morning of 9 June and Venus Pluto square in the evening of 9 June. It was too long to explain all considerations in writing, so I recorded the video.
I’m back-testing all day again to see if I can nail the exact date of the top. Come back tonight to see the results.
Update on 7 June 2025
In view of the most recent back-testing results published above in two separate blogs: Mercury conjunction Jupiter and Venus in Taurus,
I am hereby presenting the pink fractal as an alternative fractal to take us to 8-9 June 2025.
If it gets invalidated by a red closure on 8 June, we refer to our official fractals as below.
Update on 4 June 2025
My main ace in expecting 5-6 June to make the local bottom and at the same time to close on GREEN is the Mercury T square with Rahu and Ketu.
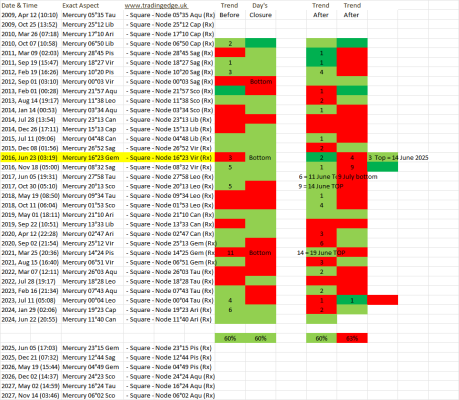
Firstly we have 60% historical probability of closing the day on GREEN. Secondly we have 60% historical probability of the Trend After to be UP. And thirdly and most importantly, the last time we had this T square on very similar degrees to 2025, was 23 June 2016. You can see it on the bottom of the chart below where I have written 23 June 2016 = 5 June 2025. That was the day of the T Square on similar degrees to where we are now. It made a well shaped bottom, closed on a GREEN and was followed by a UP trend after. I expect that we are going to fulfil all of these conditions because that is a very rare aspect and a very serious aspect.
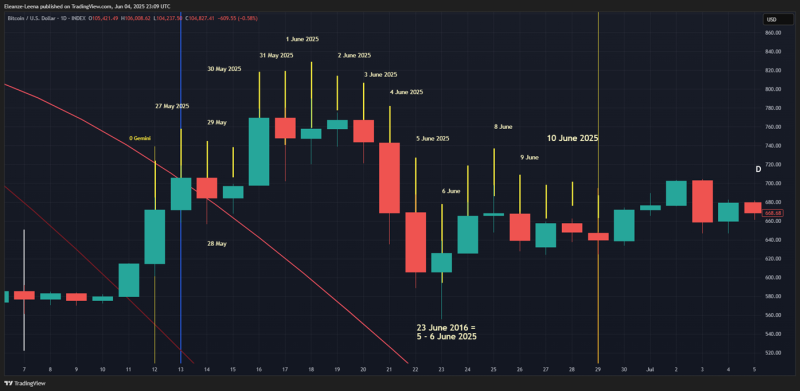
Here we are again on the same chart that gave us the Mercury entry in Gemini projection a few days ago. However We did not get that parabolic shape in the first few days of Mercury’s entry in Gemini, because Mercury made a conjunction with the Sun soon after that and the conjunction with the Sun had a U shape historically. I posted that on X a day before the event and the market delivered exactly 2 red candles as that U shape showed us. After which the trendline came back to the Mercury in Gemini shape on 1 June and has been accurate on every daily timeframe since 1 June. 1 and 2 June closed on GREEN exactly as this chart shows. 3 June made the local bear reversal and closed on RED as forecasted. 4 June is closing on RED 40 min from now, as this chart forecasted. I forecasted a GREEN closure for 4 June publicly because I have 4 cycles converging on that, but it closed on RED exactly as this Mercury in Gemini shape is showing. So, this shape is now giving us 5 – 6 June as the bottom and closing on GREEN. I state 5 – 6 June bottom because my fractal is showing 5 June lower than 6 June. And the exact T square is on 5 June which coincides with that bottom candle. However it could be 6 June. The whole 5-7 June is the bottom zone in the 24 seasons chart.
Getting this T square exactly on 5 June is a very useful new confluence to the 5 – 6 June bottom projection.
Update on 2 June 2025
We got a green closure yesterday 1 June 2025 thanks to most cycles predicting a GREEN closure on the Daily Timeframe. I expected the combo of bull and bear aspects to give us a volatile day with a deeper bottom and a well-defined top. It gave us a net result: subtract the red from the green aspects and you get a small green. That is the other way to manifest a combo of bull and bear aspects on the same day. It’s either volatile where both bull and bear aspects get their own way at some point during the day, or we get a net result of their interaction. As it was Sunday it made more sense to expect volatility and also that was forecasted by the fractals which have been running accurate since 22 May. Nailing local moves is a challenge.
Forecast for a bottom on 3 or 5 or 7 June at the latest
Yesterday and today seem to be that local top I was trying to nail. If you recall I forecasted 1 – 2 June to be a local top and then a steep down to the bottom for June, 1st half. A top does not have to look like a pivot high on the charts. A top can be the level from which the price falls down. The most vulnerable days for a bottom are 3, 5, 7 June. We’ll see what happens tomorrow 3 June, if we get a hammer then we have the bottom, if not, then 5 June has a good chance to become the bottom. If 3 or 5 June do not make a bottom, then 7 June is the last chance.
Confluence 1 for the above forecast:
Venus Chiron conjunction back-testing results show that usually this conjunction is a top or 1-2 days before a top.
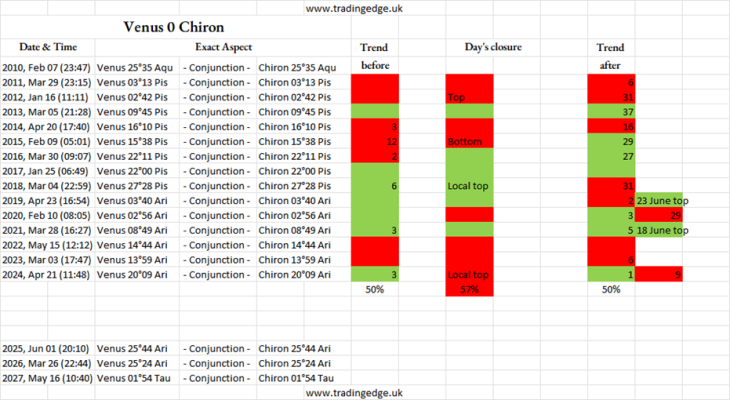
The conjunction happened yesterday 1 June.
Confluence 2 for the above forecast:
Seasonal bottom on 5-7 June. The 24 seasons forecast is currently running with 60% accuracy so it deserves to be taken seriously.
It favours 5 – 7 June to make the bottom for June.
The only thing that can screw this forecast is the current geo-magnetic storm today 2 June. It is expected to be the worst in the whole week. The space weather forecast predicts today to be the bottom for space weather. It is still 11am as I’m writing this. If tonight closure gives us a hammer, then tonight will be the bottom but that is not supported by any astro cycles.
Update on 28 May 2025
Just to remind you that whatever happens in June we are on a bull trend. Very important to know the big picture in times of volatility.
The Rahu Saturn conjunction which took place on 14 April 2025 has happened only once before in Bitcoin’s life and when it happened in 2013, Bitcoin went up for 65 days. If that history repeats again, the projected date for a top is 18 June 2025 and then a double top on 23 June 2025. We have lots of bull cycles in June ending much before these dates, I listed those pivots in my forecast yesterday. You can see it further below. All we do for now is we acknowledge that this serious bull cycle is projected to top in June, like several others. But this one is the most serious of them, because it happens very rarely. The rarer the event the more influential. So we use this projection as a confluence for the upside trend in the first half of June and we’ll worry about the exact pivots nearer the time. Without even seeing the monthly closure of May, we will be shooting in the dark if we try to nail the exact pivots at this stage. I’m enjoying that so many cycles are converging on the same statement about June as a month of a top and a double top, and I’ll be narrowing down the pivots at the next stage after all pivot dates have been short-listed.
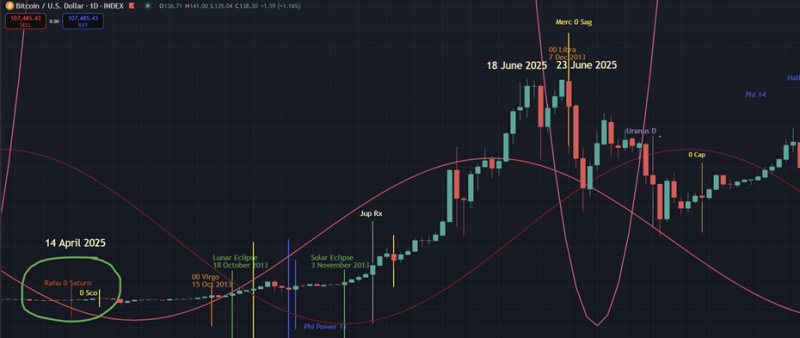
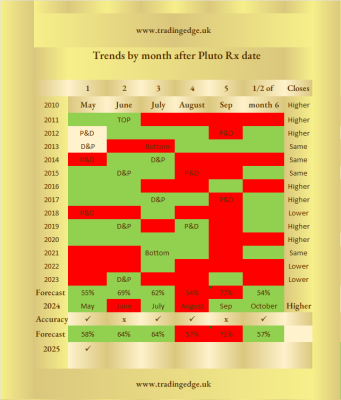
Pluto Retrograde is projecting a GREEN closure of June and last year this cycle had 67% accuracy.
In my Ethereum video that I published recently on YouTube, I gave 8 separate cycles projecting June to be a month of a top and a bear reversal. Those same cycles are relevant to Bitcoin as well.
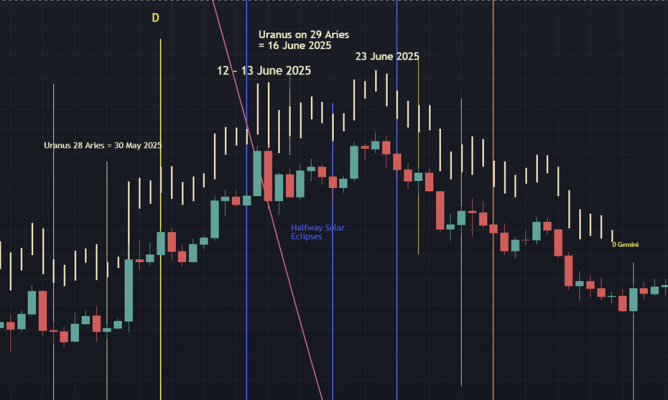
Uranus cycle is one of those mentioned in the video, again a very rare event and again projecting a top and a double top in June. The extracted pivot dates are 12 June for Top 1 and 23 June for Top 2.
All of the above cycles that I use are my unique and original tools that are above & beyond the standard cycles. All of the fractals are showing the daily timeframes very clearly and that is because I have deliberately exaggerated them to show us the daily timeframes clearly. And we guide ourselves every day by looking at these fractals and making conclusions on which cycle we are. Do you see here on this fractal that the equivalent to 25 May was the bottom? So if the long entries on 25 May remain intact, that means that this cycle is very influential on the current market. If the price dips lower than the 25 May low – that means this cycle is not that influential. The fractals above deserve a place in the forecast because they are rare cycles. The official fractals are in the main forecast below.
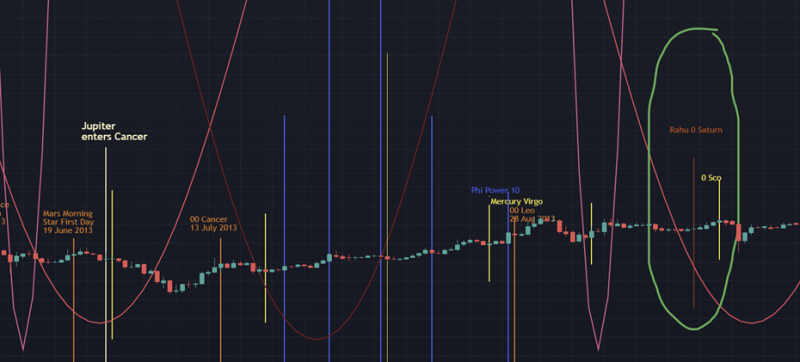
As this update is on the subject of rare events in Bitcoin’s life in June 2025, it is essential to cover another big rare event which is expected to impact Bitcoin however not on daily TFs but on a bigger TF, as it lasts a whole year. This is Jupiter in Cancer. Once in 12 Years! Just this event by itself could be used as a reason for a strong bull bias for the Yearly TF. It is the easiest tool to use to assess the yearly TF. We simply ask the question: what happened last time when Jupiter was in Cancer and we get the answer – 2013 – up up up. You can use the same question to assess your yearly TF in your own personal financial forecast. How was 2013 for you? It will be the same this year. Jupiter ensures that, because the 12 year cycle is a big influential cycle.
But it is invisible to the inexperienced eye because it operates on Yearly TF and on a daily frame we feel the same drudgery as any other year. Unfortunately the Jupiter cycle doesn’t improve the daily timeframes experience. The daily timeframes fluctuations are at the mercy of the Moon and the fast planets: Sun, Mercury and Venus.
This is what happened last time when we had Jupiter in Cancer. Bitcoin dumped for 9 days after the ingress. 9 June 2025 ingress + 9 = 18. This cycle is projecting 18 June as a pivot low. My official pivots are listed in the forecast below. In the list of pivot lows I have given 16 and 19 June. So, 18 June is joining the list of pivot lows in 2025.
An interesting fact to those of you who have a passion for speculation like me, Jack Gillen attributes number 9 to Jupiter and not to Mars as we do in traditional numerology. And that is because Jupiter rules the 9H. If you enjoy speculating and if you enjoy observing evidence for the cycles of life, pay attention to numbers 9 and 18 on 9 June when Jupiter enters Cancer. According to Jack Gillen on that day 9 and 18 have a higher chance to be drawn in the lotteries. And also I expect these numbers to show up on the trading charts somehow. Hopefully not by bringing us $99K price. Cancer is on 120 of longitude, so number 120 is expected to be circulating around. Cancer is also number 4 so number 4 and number 9 together are also expected to be activated as 49 and 94 or any other combination. That was a relaxing game before I give you the most important information in the whole year 2025. What happened after Jupiter entered Cancer? Bitcoin topped on 29 November 2013. Entered Cancer on 25 June 2013. 25 June 2013 – 29 November 2013 = 157 days. 9 June 2025 + 157 = 13 November 2025 – projected top date in 2025. This is the 1st shortlisted date for the Pivot High of 2025. We keep a record of them as they come along from various calculations. My Gann date for the highest price in this bull cycle is 12 January 2026. But I will not be brave to hold until then. I’ll be selling in September, October at the latest. This is just a short listed date and it is important because Jupiter is a slow planet and therefore it is influential.
End of this update.
June 2025 forecast below was written on 27 May 2025
June is expected to top in the 1st half of the month and head down for the rest of the month.
Be alert to the making of a top in June 2025. The minute we see a well-shaped top on daily TFs, that would mean a bear reversal and price heading down. The reason why Bitcoin keeps not going down is because we don’t have a top. No top = no down. Below I will give you my dates for the tops in June, however all of us need to be alert that a top may be made any time from now and therefore all other pivot high dates may get invalidated.
Be very alert in the first 2 weeks of June when Mercury is combust and is creating a lot of confusion. How that looks on the trading charts is spikes up and down and surprise closures like 27 May. Also the example I’m giving you below shows you the candles on the top how difficult they are to enter a short. The short in June is a SWING SHORT. That is why anyone who tries to enter that short, will be punished, at least once. It’s going to be the most difficult exercise entering that short. I am actually going to try to do it. I will give a call on X if I’m ready with a precise entry time.
Bitcoin June 2025 monthly TF closure: GREEN. I reserve the right to change my bias by mid month and no later than that. I changed my bias for May exactly in the middle of May, thanks to 9 days of stalemate when it was impossible to know what cycle was running the show. I reported my change of bias from short to long on one of the updates here.
May 2025 recap
I hope all of you were reading the updates here on the website. I audited the updates and I got 9/11 correct. Feel free to audit them for yourself. I put that in an email to myself because I like tracking my forecasts. If you want that email, I’ll be happy to send it to you because accuracy on paper is very important as that is the opposite to perception. I saw the perception in a few people around, that as I started May with the wrong bias, I was wrong for the whole month. Far from that, by 2 May I was already posting bull evidence in the updates on this website. I just needed to get sufficient evidence to change my bias. The fractals performed well from the start. 2 of the fractals: the blue and the orange fractal remained valid until the end and the orange fractal is now continuing to be valid so far. And thanks to that, my fractals for June are clean, nothing like the mess that was in May. Intermediate periods are notoriously difficult to forecast. May gave me the evidence for which fractals are running the show right now, but I didn’t have that in the beginning of May. I have only 3-4 fractals on 2 charts for June.
Forecast for 1 June – 12 June
Top 1 in June is extracted by Mercury in Gemini back-testing. In the picture below you can see dates. These are the dates extracted for June 2025. Top between 31 May – 2 June 2025 features most frequently. And 1 June features most frequently.
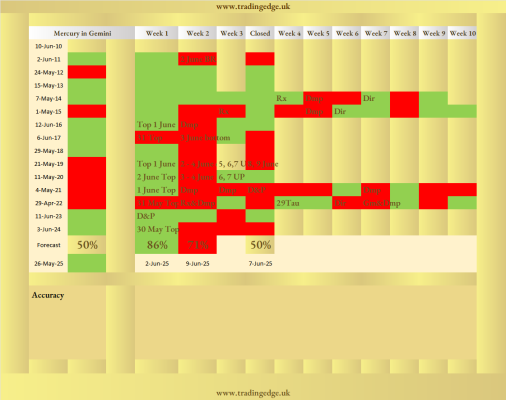
You can see 86% probability of week ending on 2 June to close on a GREEN in relation to 26 May. Regardless on which date the top is in that week. Meaning that if the top is before 2 June, 2 June is still expected to be high price.
Week 2 is given as 71% closing on a RED. Remember weeks are counted from 26 May when Mercury entered Gemini. You can see RED dates extracted in Week 2: 3 June is the most frequent one that features in all occasions and surrounding 2 days, call it 2-4 June, we expect the local bear reversal to take place and reach a local bottom as well in that span of 2-3 days. By 5-6 June should be reversing back to bull. We have a massive bull cycle ending on 11 June and I really don’t expect indulgence to the downside. Sharp and deep as there are only 2-3 days to do dumping. Historically that is how it has been. I checked all Mercury cycles and the 2nd week tends to have only 2-3 days of dumping.
The chart below gives you a projection of what Mercury in Gemini has done before on more than one occasion.
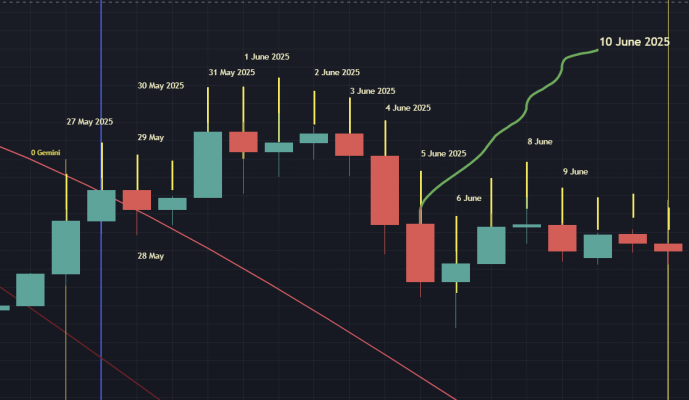
You need to be aware that the confidence of the projection is higher for the days up to 2 June because… the probability is higher 🙂 86%! The confidence in the projection after that declines slightly to 71%. My main cycles are extracting 12 – 13 June as a Top 2, and if 10 June is low, there will need to be pumps to make 12 June a top. The meaning of this picture is that 10 June should be higher than 5 June. It is exaggerated so I don’t claim that it will be that high, just higher.
Here it is Bitcoin Official Fractal 1 extracting 1 June as Top 1 and 12 – 13 June as a Top 2. The fractals are deliberately big so you can see the nature of the sticks and trade them. The fractals do not claim that they forecast the price, only the direction of travel and the relationship between the sticks is a bonus, i.e. call the pivots.
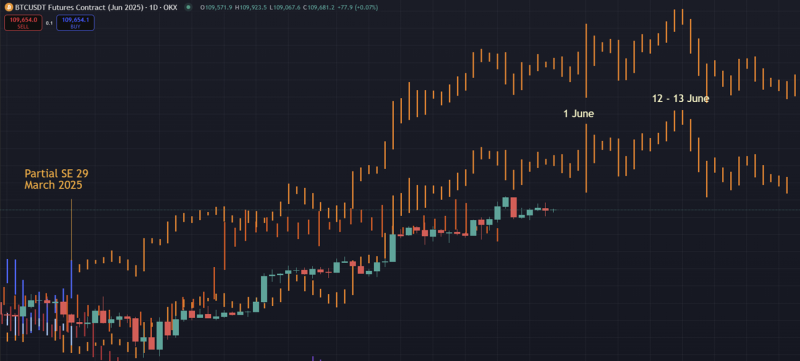
And here is the Bitcoin June 2025 Official Fractal 2.
What I mean by official is that these cycles have been validated many times before and they have forecasted the direction of travel and a few pivots many times before. These are the most trusted fractals. However we can never trust something 100% and that is why I never stop researching. The more confluences – the better. In my regular updates I will be presenting confluences for and against the above forecast.
All updates will be here and it is worth checking every day as I have a lot of back-testing results coming.
Pivot lows in June 2025
25 June is standing out as a very low date, could be 26 – 29 June when that pivot low takes place.
Other pivot lows are 16 June and 19 June. If 12 June is a top, then 13 and 14 look like red candles.
Volatile 2-directional Daily TFs in June 2025
You can see the volatility of some days. 1 June is looking very volatile. That is expected from astro events because it has lots of bull and bear astro events so that is how they manifest – by travel in both directions.
The whole point of posting fractals is to avoid empty words. Ideally I would like to just give the fractals in the beginning of the month but I’m finding people are constantly asking me questions kind of wanting wordy explanations and I really don’t understand why that is. Words bring a lower level of understanding than visuals. That is why people make an effort to create visuals – to facilitate understanding. However there are different learning styles so those who struggle to understand the material, or specifically the daily TFs reasoning and how to invalidate directions there, just get the VIP version of the Daily Timeframes Forecast and I’ll be happy to provide personalised service to you. Personalised customer service is not included in the £33 Daily TFs. The video explains the basic things about the daily timeframes however the reasoning how to invalidate directions is an art. I don’t expect you to know it but also don’t expect me that I have time to teach how to reason about invalidating directions among the daily TFs. It takes me 2 hours a day to check cycles to have an idea where we are going and to keep myself sober from my inherent bias. So it is impossible to teach all considerations I use to individuals. However I deliver regular and good quality customer service by providing frequent updates. In those you can see my reasoning about conflicting cycles.
Conflicting cycles in the daily TFs is the most common question. That is an art to decide which cycle will win and it is earned through hours of work.
And the second most common question is… about something that I have not mentioned, which frankly infuriates me. If I knew that I would have said it. If I hadn’t said it- means I don’t know it.
To answer a question competently it takes hours of research. I am on a life ban from using intuition. I despise the method of intuition because it lacks clarity. They get vague ideas. Vague idea is worse than no idea.
In June I will continue posting regular updates and that is a good quality customer service. Personalised service only for the VIP clients. The rest of my time is needed for my research as you all want to know the pivot when the sell in Q4.
The quickest way to understand the daily TFs: conflicting cycles on a daily TF = non-tradeable day. The smart thing to do is examine the fractals and identify the volatiles days and make plans to trade those days. Long stick = volatile day. Short stick = insignificant day and a nightmare to trade. The fractals do not guarantee that the daily TFs they are projecting are correct. The key function of a fractal is to give the correct direction of travel and 1-2 exact pivots or near pivots.
You can see how tough May was. There were only a very small number of days that were tradeable. We had 9 days of a stalemate. That is why I couldn’t invalidate my bias sooner, as the price froze horizontally for 9 days.
If I see the price diverging from the fractal, I’ll be researching like mad at that point, so again there is no need to ask me what is happening because that’s what I will be trying to find out and as soon as I find out, it will be posted here.
So please examine the fractals carefully and plan to trade on the tradeable days.
I’ll get back to you in a couple of days. I’m back-testing some more astro events in this month. Please come back on 30 May, there will be a new update on 30 May.
Keep sane and safe in this tricky Mercury combust period.
Blessings,
Leena.