
Ethereum Forecasts
Ethereum Forecast for June 2025
10 June 2025
Ethereum Q2 top is shaping right now.
We have 2 confluences for that: The yellow orange fractal is giving us 10 June Top and the Daily TF today is giving us a top for today 10 June 2025. Today’s daily timeframe is an extremely bullish day for Ethereum historically.
I expect pumps on ETH today starting any time from now.
We need to wait for the swing failure pattern to play out before entering a short position. The SFP can materialise any day from now. Most likely on 11 – 12 June 2025.
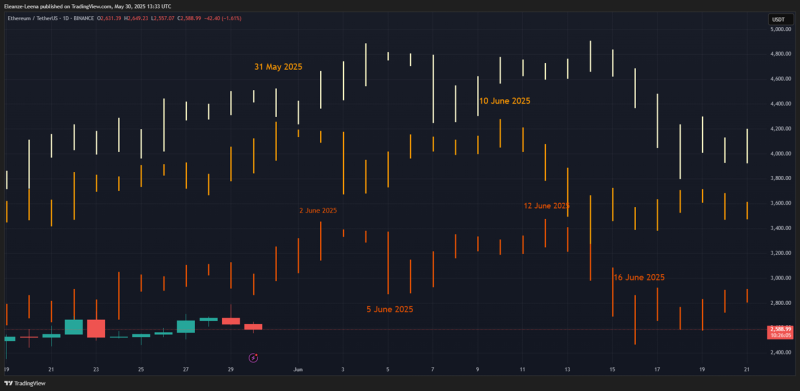
The deep orange fractal that is closest to the price action is running most accurately at present. Still the other fractals are needed to cover us if the price diverges away from the orange fractal. For example 1 June is a historical RED day for Ethereum as you can see on the Daily Timeframes back-testing.
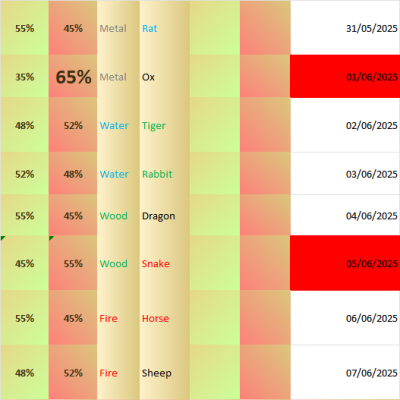
Are you all using your Daily Timeframes forecasts in your Ethereum packages? They are the best confluence for any projection of the future. Just a quick look at them and they give us this 61% probability of a RED closure on 1 June. So it is likely that the price action will move onto the white fractal on the top where 1 June is dumping. And the yellow-orange fractal is dumping on 1 June as well. Then the Daily Timeframes give us a 55% probability of 5 June closing on a RED, which is a nice confluence to the fractal extracting 5 June as the next bottom. Therefore 5 June is my swing date to enter a long position.
If you scroll up to the top of your Daily Timeframes forecast
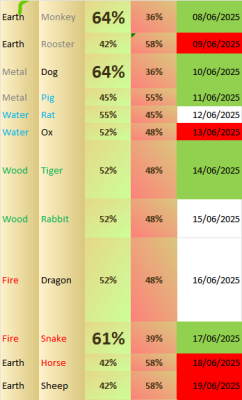
and you see that 5 June is a proper swing bottom as most of the days after that have higher probabilities of closing on GREEN all the way to 12 June by orange fractal and all the way to 17 June by the Daily Timeframes forecast. In this way the Daily Timeframes give us the likely trend ahead.
Do you see how the Daily Timeframes forecast functions? Not only predicts Daily Timeframes closures, but also predicts the trend and all of that based on historical performance. So we need to be realistic about what we can get out of it as there are always new combinations of astro events and new events entirely. But still my Chinese cycle is one of the most robust predictor of trends and I’m very pleased with its performance in the past, that is why I am sharing it with you. Just for the record, I am the only person in the world who is using Chinese Astrology cycles to predict the markets and this system I am sharing with you is unique and original.
The Daily Timeframes forecasts are a fantastic tool that you have in your package and I hope you are using it. It is a ground-breaking piece of research.
I’ll provide another forecast for the days after 17 June 2025, nearer the time. You have the fractals to give you the expected shape of the trendline and you have the Daily closures probabilities acting as confluences to the forecasts made by the fractals. They are showing us that 18 and 19 June are historically RED days for Ethereum.
Is everyone clear that the fractals do not forecast price? I have stretched the fractals on purpose so that we can see the candles very well and that is why they are so high. I don’t expect those prices however they are possible. The trend is certainly bullish for the 1st half of June 2025.
In my experience the bases of the fractals are more accurate than the top end of the sticks of the fractals. The bottoms of the fractals are good indicators of the support and therefore the shape of the trendline and which day will break the support. Today 30 May is such a day, extracted by the deep orange fractal as suitable to enter a long as tomorrow 31 May is given to be higher price. The next day for a long is 5 June 2025 as given on the deep orange fractal. You can see all the pivots extracted by the fractals for yourselves. Sharing my research with you without any promises that this time the patterns will repeat. Your trades are your responsibility.
I wish you successful trading in June.