Backtesting
Mercury Square Black Moon Lilith on 7 and 25 July 2025
As it happens twice in July 2025, it is useful to know what this aspect correlates with on the Bitcoin charts.

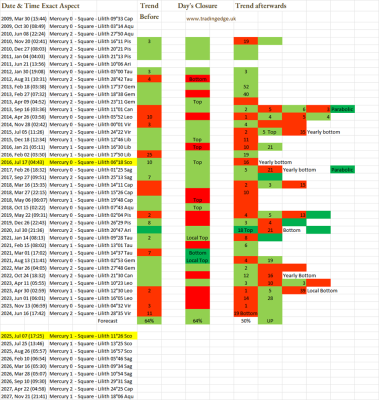
Trend before the event is UP with 64% historical probability.
Day’s closure is GREEN with 64% historical probability.
Trend after is refusing to be decisive.
There is also 1 event in 2016 is almost identical to 2025. The day of the aspect was a local top followed by 16 days down to make the 2nd Half Yearly bottom.
7 + 16 = 23. Highly unlikely that Bitcoin in 2025 will be sliding down all the way to 23 July because of the cycles I discuss in the July 2025 article. But it is a confluence to my 16 July bottom. That would be 9 days down after 7 July. A bit difficult to contemplate 9 days down during all of the bull cycles that we have in July, so they may not be straight down, but ultimately may lead to a bottom on or around 16 July.
Also this aspect is useful as a confluence to our Week 1 of July closing on GREEN as I discussed we have bear cycles bottoming in Week 1 of July as well. Even if they materialise, Mercury square BML gives us 64% assurance that by 7 July we will be on a UP trend.
